Join Examsbook
यदि प्रतिवर्ष उत्पादित होने वाले प्रकार के नमूनों की संख्या का 85 % बेच दिया जाता हो तो बताये D प्रकार के मोबाइल जो नहीं बेचे गये की कुल सख्या क्या है ?
5Directions: The bar chart given below shows the percentage distribution of the production of various models of a mobile manufacturing company in 2007 and 2008. The total production in 2007 was 35 lakh mobile phones and in 2008 the production was 44 lakh. Study the chart and answer the following questions.
Percentage of six different types of mobiles manufactured by a company over two year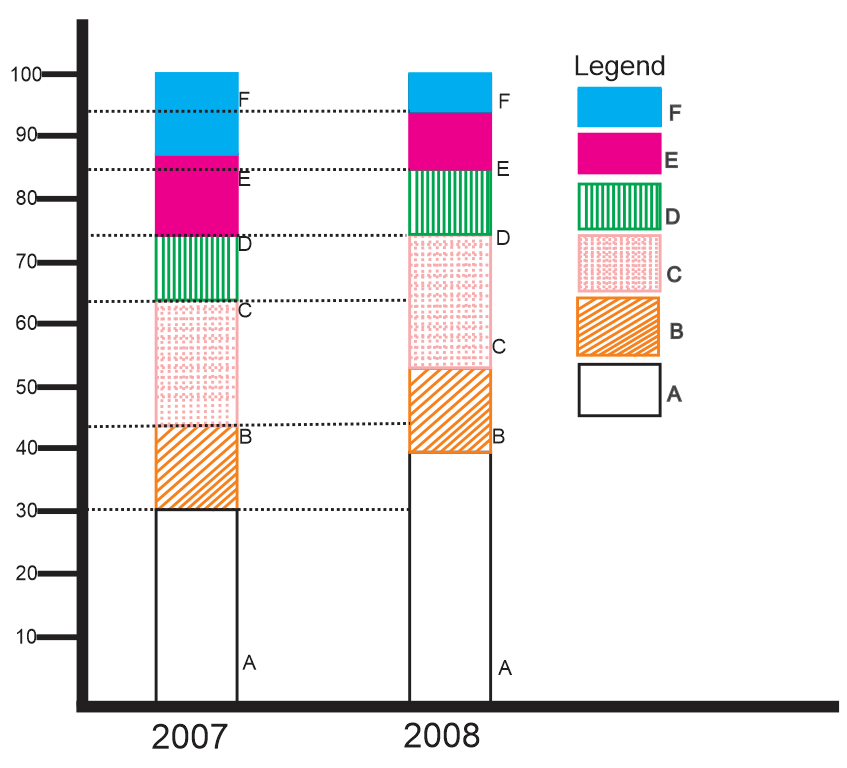
Q:
यदि प्रतिवर्ष उत्पादित होने वाले प्रकार के नमूनों की संख्या का 85 % बेच दिया जाता हो तो बताये D प्रकार के मोबाइल जो नहीं बेचे गये की कुल सख्या क्या है ?
- 176,500false
- 293,500false
- 31,18,500true
- 41,22,500false
- Show AnswerHide Answer
- Workspace