जॉइन Examsbook
दिखाई देने के लिए योग्य उम्मीदवारों के प्रतिशत के बीच अंतर अधिकतम था जो निम्नलिखित जोड़ों में से एक है?
5The following line graph gives the percentage of the number of candidates who qualified an examination out of the total number of candidates who appeared for the examination over a period of seven years from 1994 to 2000.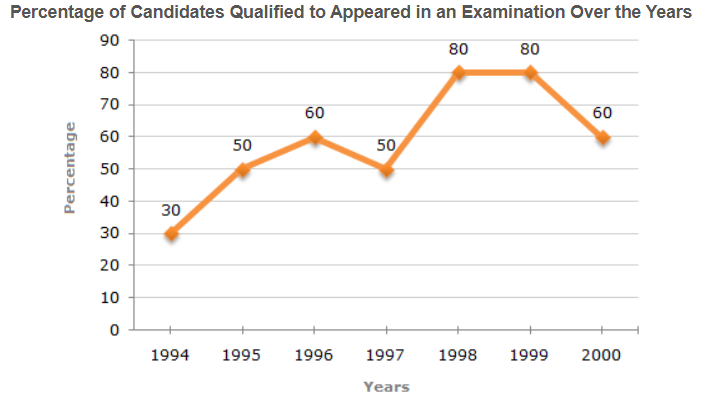
प्र:
दिखाई देने के लिए योग्य उम्मीदवारों के प्रतिशत के बीच अंतर अधिकतम था जो निम्नलिखित जोड़ों में से एक है?
- 11994 and 1995false
- 21997 and 1998true
- 31998 and 1999false
- 41999 and 2000false
- 5इनमें से कोई नहींfalse
- उत्तर देखेंउत्तर छिपाएं
- Workspace