Join Examsbook
T शहर में ब्रांड A के उपयोगकर्ताओं की संख्या शहर Q में ब्रांड B के उपयोगकर्ताओं की संख्या का कितना प्रतिशत है?
5Direction: Study the following graph carefully and answer the questions that follow:
The graph given below represents the number of users of two broadband services A and B across 5 cities P, Q, R, S and T.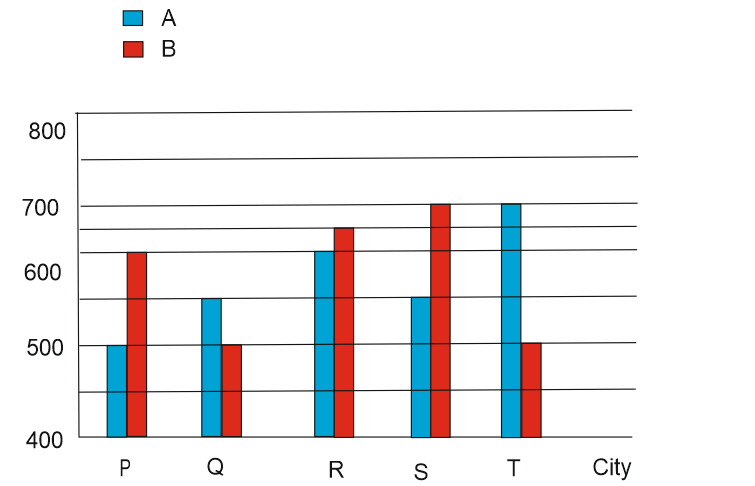
Q:
T शहर में ब्रांड A के उपयोगकर्ताओं की संख्या शहर Q में ब्रांड B के उपयोगकर्ताओं की संख्या का कितना प्रतिशत है?
- 1150false
- 2110false
- 3140true
- 4160false
- 5120false
- Show AnswerHide Answer
- Workspace