जॉइन Examsbook
जुलाई में सभी चार शहरों में मामलों की कुल संख्या अगस्त में कुल मामलों से कितनी अधिक या कम है?
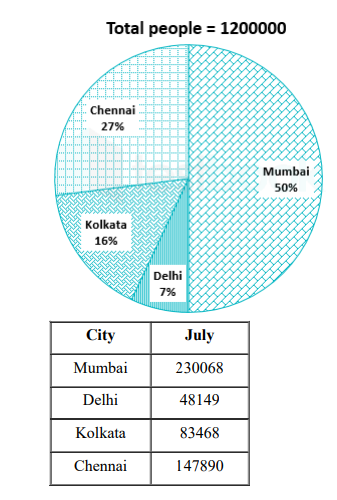
5Directions: Read the given pie and table carefully and answer the following questions.
The pie chart shows the percentage distribution of people who found COVID – 19 positive in four major cities of India from 1st July to 31st August 2020 and the table shows the number of people who tested positive in July from these cities.
प्र:
जुलाई में सभी चार शहरों में मामलों की कुल संख्या अगस्त में कुल मामलों से कितनी अधिक या कम है?
- 1509575false
- 2690425false
- 3180850true
- 4245689false
- 5इनमें से कोई नहींfalse
- उत्तर देखेंउत्तर छिपाएं
- Workspace