Join Examsbook
शिक्षा पर खर्च और भोजन पर खर्च का अनुपात कितना है?
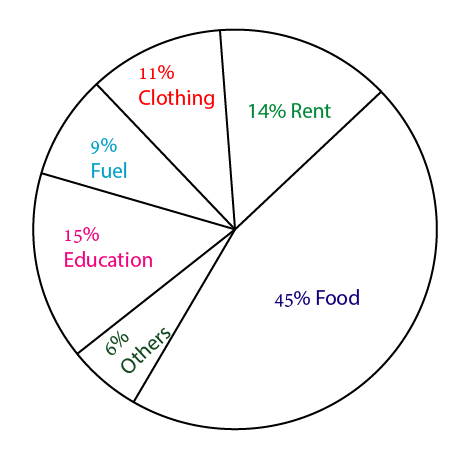
5Directions: The pie chart given below shows the spendings of a family on various heads during a month. Study the graph and answer the following questions.
Q:
शिक्षा पर खर्च और भोजन पर खर्च का अनुपात कितना है?
- 13 : 5false
- 25 : 3false
- 31 : 3true
- 43 : 1false
- Show AnswerHide Answer
- Workspace