जॉइन Examsbook
कुल व्यय (रु. लाख में) ज्ञात कीजिये।
5Direction: The pie chart shows the breakup of expenditure of a software company for the year 2017. Study the diagram and answer the following questions.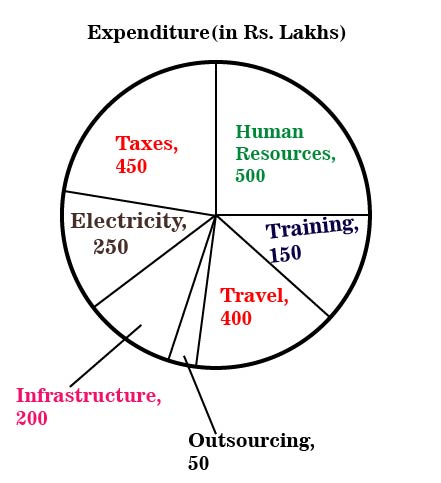
प्र:
कुल व्यय (रु. लाख में) ज्ञात कीजिये।
- 11800false
- 22000true
- 32100false
- 42250false
- उत्तर देखेंउत्तर छिपाएं
- Workspace