चुनिंदा डाटा इंटरप्रिटेशन प्रश्न और उत्तर


निर्देश (20-21): नीचे दिया गया ग्राफ एक कारखाने में 50 श्रमिकों की दैनिक आय दर्शाता है। ग्राफ का अध्ययन करें और प्रश्नों के उत्तर दें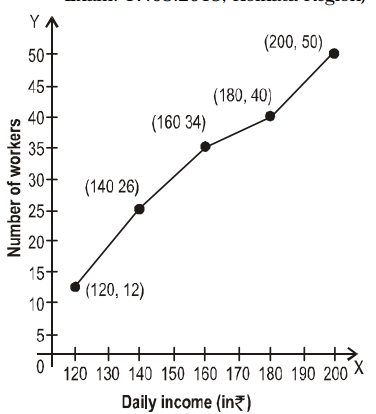
कारखाने में औसत मजदूरी है
(A) 150
(B) 160
(C) 140
(D) 138
Correct Answer : B
Showing page 6 of 6
hnhttps://www.hindi.examsbook.com/data-interpretation-question-and-answer/666data-interpretation-question-and-answerलेखक के बारे में

Vikram Singh
Providing knowledgable questions of Reasoning and Aptitude for the competitive exams.
और अधिक पोस्ट पढ़ें